Frequently Asked Questions
In the Ashburton District the only public water supply that is fluoridated is the Methven Supply. This supply feeds both the Methven Township and the surrounding Methven-Springfield rural area.
The Methven Supply is fluoridated at the Methven Water Treatment Plant (WTP) using Hydrofluorosilicic Acid (HFA) liquid.
The target setpoint for fluoride dosing at the Methven WTP is 0.80mg/L (or parts per million).
The Methven WTP has an online Fluoride analyser that reads the fluoride level every minute continuously. Weekly manual samples are also collected from treated water and sent to an external Laboratory for fluoride analysis.
The Methven WTP has an online Fluoride analyser that reads the fluoride level every minute continuously. Weekly manual samples are also collected from treated water and sent to an external Laboratory for fluoride analysis.
The online fluoride analyser is a WTP instrument that is maintained by the WTP operators. Weekly manual samples are collected by Ashburton District Council (ADC) monitoring staff and sent to an external laboratory for fluoride analysis. Our current provider for this is Eurofins ELS Ltd.
Wastewater from the Methven Township is discharged to land at the Methven Wastewater Treatment Plant (WWTP) located on Line Road, Methven. Wastewater in the surrounding Methven-Springfield rural area is managed by private on-site wastewater systems (septic tanks) as these are private, council cannot confirm where these systems might be discharging to.
No. Council holds a resource consent for the disposal of municipal wastewater to land. Refer CRC991241
The consenting agency’s investigating officer described the activity as follows:
We contend that the consent to discharge wastewater to land permits the discharge. The relevant section is Condition 1 of the subsequently issued resource consent. This states “The total volume of treated effluent discharged into land described as RS 41251 PT RS 28288 BLK VII Spaxton SD (‘the Site’) via rapid infiltration basins shall not exceed 1,000 cubic metres per day.”
Please also note, the Canterbury Land & Water Plan has no reference to fluoride, which suggests it is not a matter of concern.
No. Fluoridation of Community Water Supplies is not an activity controlled by the Resource Management Act and as such it does not require a resource consent. Fluoridation if carried out must comply with the requirements of the Water Services Act 2021, the Drinking Water Quality Assurance Rules 2022 & Water Services (Drinking Water Standards for New Zealand) Regulations 2022.
It is of course variable based on demand, but the total cost of fluoridation chemicals for the last 12 months was $24,150 exclusive GST.
The total cost of operating the fluoridation on the Methven Water Supply is $11,600 exc GST/annum. This amount comprises
- Operation, maintenance, and management by our maintenance contractor of $10,920 exc GST.
- The cost of the testing of manual samples with Eurofins is around $650 exc GST.
Note-: Excludes sampling staff costs.
As above, the cost of the testing of manual samples with Eurofins is around $650 ex GST per year. This does not include the sampling staff costs or the costs of maintaining the WTP online analyser.
$3,450 exclusive GST.
We add around 7 tonnes of HFA to the water supply per annum.
Background
In 2007 the Ashburton District Council held a binding referendum as to whether residents wanted fluoridation or not. Fluoridation had been stopped in 2002 after a Stop Fluoride Campaign was run by local resident and Fluoride Action Network NZ member, Don Church. Fluoridation had started in 1966. It was a great effort by our members and others, well rewarded.
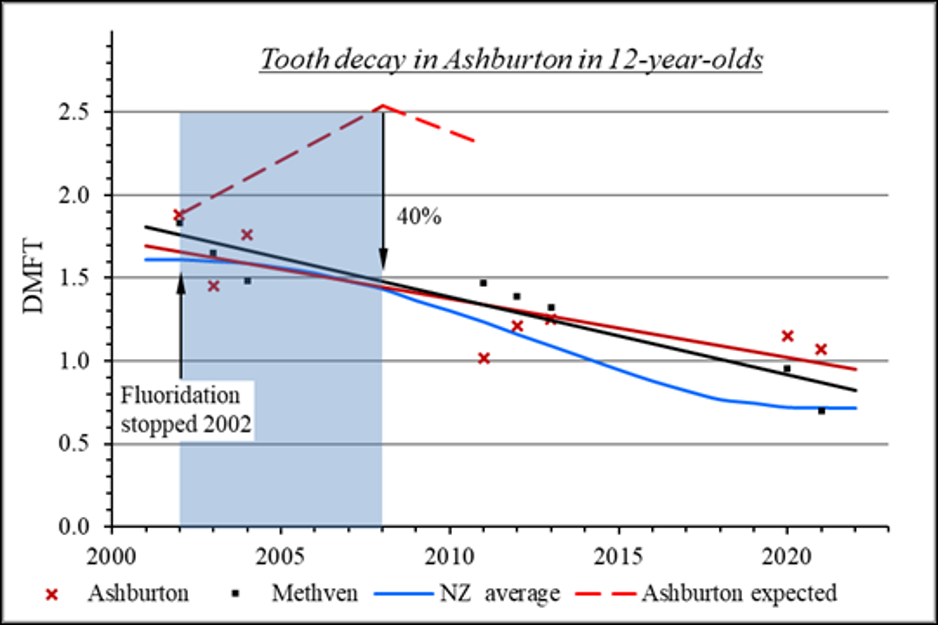
Have Dental Decay rates increased since fluoridation stopped?
In a 2006 a TV3 news item, dentist Justin Wall, claims that dental decay rates had increased since fluoridation was stopped.
2014 Official NZ statistics show dental decay improves once fluoridation is stopped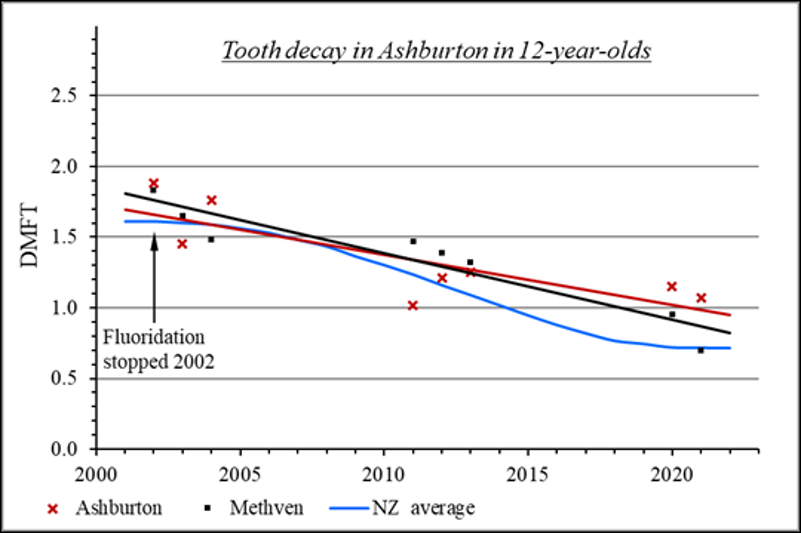
Background to the 2007 Win
With the election of a pro-fluoridation Mayor at Ashburton the Canterbury DHB and MoH have seized the opportunity to promote to the Council the reintroduction of fluoridation (ceased in 2002 following a campaign led by FANNZ committee member, Don Church). Don has again led the campaign to fend off Martin Lee and Justin Wall from the New Zealand Dental Association.
FANNZ had around 10,000 (updated) flyers printed and Don arranged for them to be distributed to every household in the area.
At the start of the campaign the MoH boycotted the Council’s proposed 2-sided A4 sheet to go out with rating notices. This boycott placed Council in the position that it accepted the MoH position that it could not put out the opposing view because that would be construed as not being impartial. FANNZ’ view is that by acceding to the MoH’s deliberate undermining of the democratic process the Council is not only failing to be impartial it is in breach of its statutory obligations to ratepayers.
FANNZ obtained the A4 sheet put out by the DHB in Wanganui to circumvent this travesty, but the decision had already been made. Thus the MoH and CDHB could use taxpayers’ money to flood local papers with one-sided information, advertisements etc. The MoH even funded a large “Smile for Life” billboard on the main street. It has been observed that when Councils ensure the public are informed, the vote trends against fluoridation. For future campaigns, we need to ensure that we get Councils to insist on the democratic process and publish earlier DHB material if it is not updated.
The referendum results were inconclusive. The rural areas (canvassed by a Council “response” letter) opposed fluoridation; the urban area (canvassed by a “sample” telephone poll of 400 households) came out in favour of fluoridation. Noteworthy was that the urban poll revealed that, of those who considered themselves to be reasonably informed on the subject, twice as many voters rejected fluoridation. Consequently Council decided that the rural water supplies not be fluoridated but were intending to proceed to reintroduce fluoridation to the urban area.
At the Council meeting where the proposal to fluoridate the urban area was to be further progressed the Deputy Mayor, assisted by Don, persuaded even pro-fluoridation Councillors to decide the issue by means of a binding referendum. Council has now advised that the referendum papers will be mailed out from 16th February with the closing date for votes to be 10th March 2007. This of course will now initiate a further major campaign within the Ashburton urban area.
More contrived “data” by dishonest DHBs?
During the course of this campaign, Drs Lee and Williams presented (dis)information to Council for the years 2000 to 2005, apparently showing a significant rise in dental decay in Ashburton 6-year-olds since fluoridation ceased in 2002.
When Don requested the statistical data behind the graphs Dr Daniel Williams provided 2 pages of information. It is clear from these 2 pages that only data for the years 2000 to 2004 was complete. Don was disturbed to note that decay statistics had been graphed for 2005 and yet no underlying data was supplied for the numbers of such children. Without having the numbers of children it is impossible to calculate an average decay rate, or caries free rate, per child. Don pointed this out to Dr Daniel Williams who conceded that he did not have the data but, after he referred back to Dr Martin Lee, the relevant number of children for 2005 was subsequently advised as 198. This does not leave us with confidence in the data.
However, assuming that the data is correct, one should note that the numbers of 6-year-old children in the relevant years 2000 to 2005 were respectively 197, 211, 132, 198. This is a very wide fluctuation on such a small database. In fact they are not even the same children. Such statistical deficiencies would be unacceptable in any credible study.
The average decayed, missing or filled teeth (dmft) for Ashburton 6-year-olds (as per the presentation by Drs Williams and Lee) is given as 5.1 for 2004 and 5.21 for 2005. Yet, in the similar statistics for 5-year-olds, provided by Sunitha Gowda for MoH the worst average dmft for any area in the South Island was for the West Coast at 2.6 dmft.
The MoH statistics for decay for 5-year-olds for the year 2004 show that although South Canterbury (Timaru District) has not been fluoridated since 1985 the average decay rate (dmft) for 5-year-olds in this district is only 1.82. This reduces to 1.63 DMFT for 12-year-olds. Even recognising the small age difference (between 6-year-olds in the Ashburton presentation and 5-year-old MoH statistics) it is just not credible that Ashburton could suddenly jump to a decay rate that is double that of the worst area in the South Island.
FANNZ suggests that the presentation to Council used data that was selectively skewed to produce an intended result. Similar skewed data appears to be presented to Councils as a matter of course by dishonest zealots trying to force their discredited views on an innocent public – the same approach has been used in the Waikato and Far North for example.
2001 School Dental Services Data for 5-year-olds:
This table is very helpful in that it compares decay rates with percentage fluoridated and with socio-economic status (SES). It is impossible to find any convincing benefit of fluoridation from this table. It is even more relevant to compare just the South Island areas as the population mix of the South Island is more coherent. Thus:-
(dmft = decayed, missing or filled deciduous teeth)
(DMFT = decayed, missing or filled permanent teeth)
(SES = socio-economic status)
| District | Percent of Low SES | Percent Fluoridated | Percent Caries-Free at 5 yrs | Mean mft at 5 yrs | Percent Caries-free at 12 yrs | Mean MFT at 12 yrs |
| Otago | 9 | 47 | 60 | 1.4 | 39 | 2.0 |
| Nelson-Marlb. | 11 | 0 | 50 | 2.2 | 51 | 1.3 |
| Canterbury | 15 | 4 | 49 | 1.8 | 39 | 1.9 |
| Southland | 24 | 41 | 48 | 2.3 | 29 | 2.0 |
| West Coast | 13 | 0 | 40 | 2.6 | 38 | 1.9 |
This information is revealing. For example:-
- The 2 areas that are highly fluoridated (Otago and Southland) show generally the worst decay results by year 12.
- Otago (fluoridated) shows the best results for 5-year-olds but the worst results for 12-year-olds. Note also that Otago has the lowest percent of children classified as “low socio-economic status”. This data well illustrates the contention that fluoridation temporarily delays decay (by delaying tooth eruption) but that the temporary “benefit” disappears by the time such children become 12-year-olds.
- Nelson-Marlborough area, though totally unfluoridated and with a slightly poorer socio economic status than Otago, is average in the decay statistics for 5-year-olds, but has the least decay for 12-year-olds.for the whole South Island.
- Even the West Coast, though totally unfluoridated, has less decay (MFT) in 12-year-olds than for fluoridated areas of Otago and Southland.
- The presentation to council by Drs Williams and Lee that claimed an mft (missing filled teeth) figure for Ashburton 6-year-olds of 5.1 for 2004 and 5.21 for 2005 is simply not credible when compared to the official statistics for 5-year-olds (enclosed) as provided by the Sunitha Gowda table.