The Health (Fluoridation of Drinking Water) Amendment Bill is based on the claim by the Ministry of Health that fluoridation reduces dental decay by 40%. A Ministry of Health sponsored report, carried out by Wellington-based Sapere Group, found that a reduction of 40% tooth decay would produce a saving in dental decay rates that would exceed the cost of implementing fluoridation for the whole country.
However, this claim is hugely misleading. The Ministry of Health bases this claim on the MOH Oral Health Survey 2009 and Sapere assume that the MoH claim is correct. The Oral Health Survey comes with a disclaimer by the authors that the survey should not be used as a fluoridation study (see below).
The survey data was obtained from a small sample size (around 60 children in each age group), lifetime fluoridation status was unknown and the data is from 2008 which is now completely out of date.
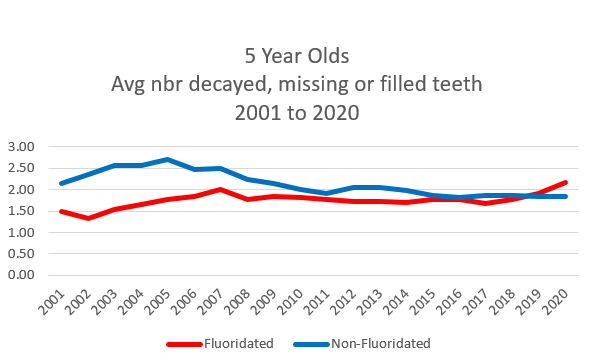
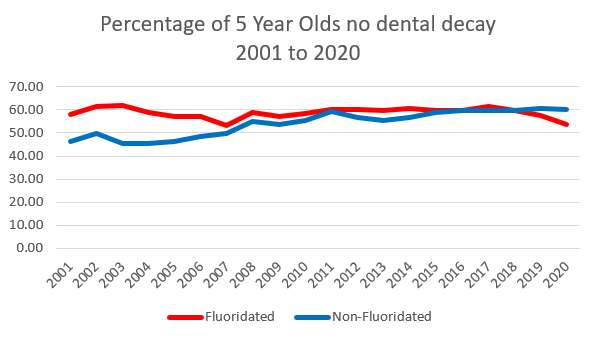
The below graphs show the average number of fillings and the percentage of 5 year old children from 2001 to 2020 (latest statistics). Over that time the gap has become non-existent because the rates of decay in fluoridated areas has not improved but rates in non-fluoridated areas has improved. This data is from the New Zealand School Dental Service and has about 30,000 children in each age group.
The 2009 Oral Health Survey did not used the NZ School Dental Statistics but instead uses a much smaller sample of children. The authors say they have adjusted for age, sex, ethnic group and neighbourhood deprivation to allow appropriate comparisons with people living in fluoridated areas. However, this reduces their sample size to around 60 children in each age and they do not provide the data to show how many from each age were in fluoridated and non-fluoridated areas.
| Age group | Nbr dentally examined | Avg nbr children each age |
|---|---|---|
| 2-4 years | 195 | 65 |
| 5 – 11 years | 438 | 62 |
| 12 – 17 years | 354 | 59 |
They have then added these figures together and averaged them out. This artificially inflates the dental decay rates as decay rates have been falling in New Zealand since the 1930s. For instance, when these 17 year olds were 12 ( in 2003), the average number of fillings was 1.57 compared with 0.89 in the latest 2015 statistics.
| Population Group | Fluoridated/Non-fluoridated | Mean 95% CI |
|---|---|---|
| Children (aged 2-17 years) |
Living in non-fluoridated areas Living in fluoridated areas |
2.4 (2.0 – 2.8) 1.5 (1.1 – 1.9) |
| Adults (aged 18 years and over) |
Living in non-fluoridated areas Living in fluoridated areas |
15.7 (15.0 – 15.4) 12.2 (11.5 – 12.8) |
| All (aged 2 years and over) |
Living in non-fluoridated areas Living in fluoridated areas |
12.1 (11.5 – 12.7) 9.6 (9.1 – 10.1) |
Source: 2009 Oral Health Survey Note: for children, this measure presents the overall mean number of decayed, missing or filled primary and permanent teeth combines (i.e. dmft+DMFT).
The 2009 Oral Health Survey also claims that other New Zealand studies have had similar findings and cite four NZ studies from 2004 to 2009.However, a closer analysis of those studies did not show any remarkable difference:
Lee and Dennison 2004, 1 tooth surface out of 120 tooth surfaces.
MacKay and Thomson 2005, 0.52 of a tooth surfaces in permanent teeth
Schluter et al 2008, for deciduous (baby) teeth “While mean dmfs scores were lower in fluoridated areas than in non-fluoridated areas, no statistically significant difference was observed”. And for permanent teeth, “There were no significant differences between fluoridated and non-fluoridated areas in caries prevalence or severity” (pg 149)
Kanagarathnam 2009: “..children who lived continuously in fluoridated areas being 0.42 times as likely to have dental caries as children who lived continuously in nonfluoridated areas..” Without knowing the actual data is it hard to tell if “0.42 times” has any real significance but considering Kanagarathnam used the same Auckland data as Schluter, it is not likely.
2009 Oral Health Survey page 167 disclaimer:
It is important to note that it was not one of the objectives of the 2009 NZOHS to compare the oral health status of people by fluoridation status, and therefore the survey cannot be considered a fluoridation study as such. The following results are for a snapshot in time, and constitute an ecological analysis based on current place of residence. As such, they do not take into consideration lifetime exposure to fluoridated and non-fluoridated water supplies. individuals who currently live in fluoridated areas may have spend time in non-fluoridated areas, and the reverse is also true. Furthermore, there may be other confounding factors that have not been taken into account in this analysis, such as the usual reason for visiting a dental health professional, and other sources of fluoride such as fluoride toothpaste.


